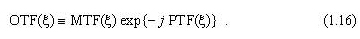
Recalling the definition of the optical transfer function
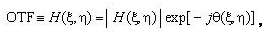
we now proceed to the interpretation of the phase response:
For the special case of a symmetric impulse response centered on the ideal image point, the phase transfer function (PTF) is particularly simple, having a value of either zero or π as a function of spatial frequency (see Fig. 1.12). The OTF can be plotted as a bipolar curve having both positive and negative values. If the MTF were plotted on the same graph, it would be strictly above the ξ axis. The PTF shows a phase reversal of π over exactly that frequency range for which the OTF is below the axis.

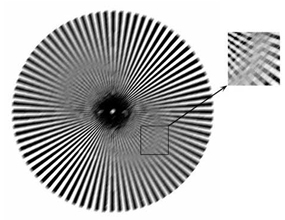
We see the impact of this phase reversal on the image of a radial spoke target that exhibits increasing spatial frequency toward the center (Fig. 1.13). The image was blurred at a 45° diagonal direction. Over a certain range of spatial frequencies, what begins as a black bar at the periphery of the target becomes a white bar, indicating a phase shift of π. This phase shift occurs in a gray transition zone where the MTF goes through a zero.
Other phase transfer functions are possible. For instance, a shift in the position of the impulse response from the ideal geometric image position produces a linear phase shift in the image. Typically this displacement is a function of field angle. If the impulse point-spread function (PSF) is asymmetric such as seen for a system with the aberration coma, the PTF will be a nonlinear function of frequency (Fig. 1.14). We do not usually measure the phase transfer function directly; rather we calculate it from a Fourier transform of the impulse response. Most often, PTF is used as an optical-design criterion, to determine the presence and severity of certain aberrations.

Nonlinearities in the PTF, also called phase distortion, cause different spatial frequencies in the image to recombine with different relative phases. The result of phase distortion is a change in the shape of the spatial waveform describing the image. Severe phase distortion produces image waveforms that are dramatically different from the object waveform. To illustrate the effects of this PTF nonlinearity, we consider the imaging of four-bar targets with equal lines and spaces. Although these targets are not periodic in the true sense (being spatially limited), we will speak of nth harmonics of the fundamental spatial frequency as simply nξf. In Fig. 1.15, we plot PTF and image-irradiance waveforms for three π-phase step-discontinuity PTFs. To emphasize the effect of the PTF on the image, we let MTF = 1 in this example, so that all of the spatial frequencies are present in their original amounts and only the relative phases have changed.
In case I (Fig. 1.15), the PTF transition occurs at 4ξf. There is no shift for the fundamental or the third harmonic, and a π shift for higher frequencies. We see a phase-reversal artifact as a local minimum at the center of each bar, primarily because the fifth harmonic is out of phase with the third and the fundamental. In case II, the transition occurs at 2ξf, so the only in-phase spatial frequency is the fundamental. The bars are sinusoidal at the center, with secondary-maxima artifacts in the shoulder of each bar and in the space between them, arising primarily from the third and fifth harmonics. The step transition for case III occurs at 0.9ξf, shifting the fundamental and all harmonics with respect to frequencies lower than ξf. The most dramatic artifact is that the image now has five peaks instead of the four seen in cases I and II.

G. D. Boreman, Modulation Transfer Function in Optical and Electro-Optical Systems, SPIE Press, Bellingham, WA (2001).
View SPIE terms of use.