Optipedia • SPIE Press books opened for your reference.
Visual Acuity
Excerpt from Field Guide to Visual and Ophthalmic Optics
Distance visual acuity is typically measured using an eye chart. Various forms of eye charts have been proposed and are in use today. The most familiar is the Snellen eye chart. Snellen acuity is given in terms of a Snellen fraction S, which is defined as

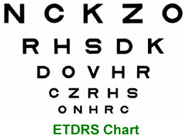
Typical testing distances for the Snellen chart are 20 feet and 6 meters. If a subject can read a line at 20 feet and the “normal” observer can see the same line at 40 feet, then the subject has 20/40 Snellen acuity. Two drawbacks to the Snellen chart are that the chart has a different number of letters on each line and the size change of letters is not constant between lines. The Bailey-Lovie and ETDRS charts overcome these weaknesses by having a logarithmic reduction in letter size from line to line and a constant number of letters on each line. Visual acuity is sometimes specified in terms of LogMAR acuity to give a continuous number for acuity. LogMAR and Snellen acuity are related by

| LogMAR | Snellen (English) | Snellen (Metric) |
| –0.3 | 20/10 | 6/3 |
| –0.2 | 20/12.5 | 6/3.75 |
| –0.1 | 20/16 | 6/4.75 |
| 0.0 | 20/20 | 6/6 |
| 0.1 | 20/25 | 6/7.5 |
| 0.2 | 20/32 | 6/9.5 |
| 0.3 | 20/40 | 6/12 |
| 0.4 | 20/50 | 6/15 |
| 0.5 | 20/63 | 6/19 |
| 0.6 | 20/80 | 6/24 |
| 0.7 | 20/100 | 6/30 |
Visual Acuity and Eye Charts
 Near visual acuity is typically tested with a reading card to assess a subject’s ability to accommodate. Jaeger scores (designated J1, J2…) are sometimes used to rate near acuity. However, these values are not standardized for size or test distance. Confusion can result from their use. A common near acuity card is the Rosenbaum card. This card is designed for testing at a distance of 14 inches. A table comparing Jaeger values, equivalent Snellen distance acuities and point sizes for Times New Roman font is shown below. Newsprint is typically between 10- and 14-point or between J7 and J10.
| Jaeger | Snellen | Point |
| J1+ | 20/20 | 3 |
| J1 | 20/25 | 4 |
| J2 | 20/30 | 5 |
| J3 | 20/40 | 6 |
| J5 | 20/50 | 8 |
| J7 | 20/70 | 10 |
| J10 | 20/100 | 14 |
Alternatively, numbers, symbols, and shapes can be used as optotypes for testing visual acuity. Common examples are the Tumbling E’s, Landolt C’s, and the Lea Symbols. In this task, the observer simply states the direction of the openings in the letter. These tests are useful in pediatric and illiterate subjects. The contrast of the chart symbols can also be reduced to determine the acuity under different conditions.

J. Schwiegerling, Field Guide to Visual and Ophthalmic Optics, SPIE Press, Bellingham, WA (2004).
View SPIE terms of use.

