Optipedia • SPIE Press books opened for your reference.
Colorimetry
Excerpt from Field Guide to Visual and Ophthalmic Optics
RGB and CIE XYZ Systems
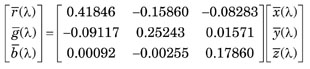
Colorimetry is based upon the response of the human visual system to different monochromatic stimuli. To determine the response, a combination of three monochromatic primaries (red(R) at 700 nm, green(G) at 546.1 nm, and blue(B) at 435.8 nm) are used. Observers adjust the relative weighting between the primaries to match a monochromatic color of arbitrary wavelength. This process is repeated for wavelengths throughout the visible spectrum, resulting in a set of color matching functions (CMFs). For convenience, these CMFs are typically converted from RGB space to the XYZ color space. CMFs for small fields of view (2°) and large field of view (10°) have been standardized by the CIE in XYZ space. The original RGB CMFs can be recovered using
Coordinates or tristimulus values in XYZ space are determined by projected the spectral distribution P(λ) entering the eye onto the CMFs. The continuous and discrete versions of the tristimulus values are given below:
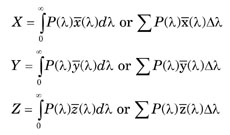
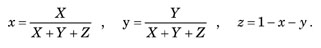
The tristimulus values are further normalized, giving the chromaticity coordinates (x, y, z).
Chromaticity Diagram
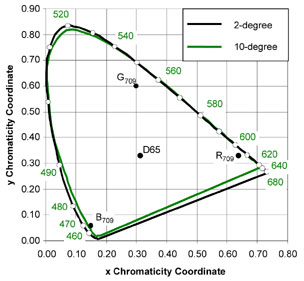
All perceptible colors are bounded by the horseshoe-shaped spectral locus in the chromaticity diagram. The equal energy white point lies at (0.333,0.333), but alternative “white” points can be defined. The dominant wavelength (hue) and excitation purity (saturation) of a spectral distribution are found with this diagram. For example, a red phosphor results in a set of chromaticity coordinates labeled R709. For a white point at the point labeled D65, a line from D65 through R709 would intersect the spectral locus at the dominant wavelength (610 nm). The excitation purity is the ratio of the distance from D65 to R709 to the distance from D65 to the spectral locus. The complementary color is found by extending a line from R709 through D65 and determining the intersection point with the spectral locus (492 nm). Purples and magentas lie in the lower portion of the diagram. These colors do not have a dominant wavelength. Excitation purity in this case is the ratio of the distance from the white point to the chromaticity coordinate and the distance from the white point to the complementary color.
J. Schwiegerling, Field Guide to Visual and Ophthalmic Optics, SPIE Press, Bellingham, WA (2004).
View SPIE terms of use.
